2015 · GS Paper 1 · Q10 · 12 marks
How do you explain the statistics that show that the sex ratio in Tribes in India is more favourable to women than the sex ratio among Scheduled Castes?
In short
The more favourable sex ratio among Scheduled Tribes reflects bride price, women's visible economic role, flexible kinship and limited access to sex selection, while Sanskritisation and north-western concentration depress it among Scheduled Castes. Census 2011 recorded 990 females per 1,000 males among STs against 945 among SCs.
Model answer
Ghissu Editorial · Verified 4 Oct 2026 · 270 words
Bride price
Tribes such as the Gonds and Santhals pay a bride price, so a daughter brings wealth instead of a dowry burden.
Women's economic role
Tribal women are valued earners in shifting cultivation and forest produce collection, which gives them autonomy.
Flexible kinship
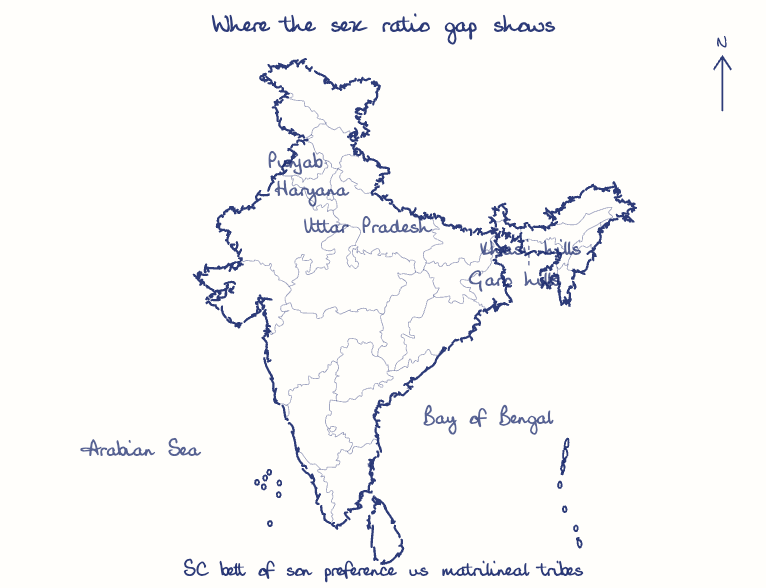
Matrilineal Khasis and Garos, and freer divorce and widow remarriage, reduce the stigma of being a woman.
Limited sex selection
Remoteness and weak market reach have restricted access to ultrasound-based sex determination.
Sanskritisation
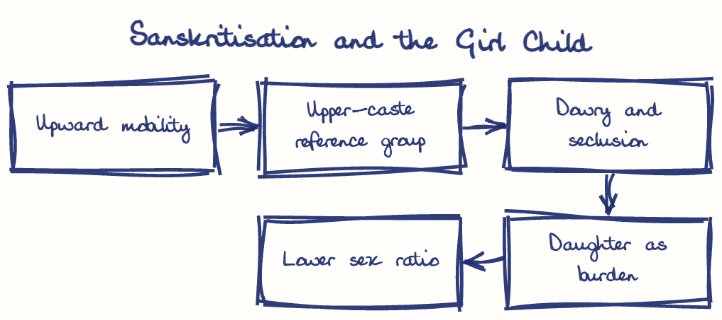
As M.N. Srinivas explained, castes seeking status copy upper-caste dowry, seclusion and bans on widow remarriage, which make the girl child a liability.
Regional concentration
SCs are concentrated in the son-preferring north-west, about a third of Punjab's population, while STs live mainly in the North-East and central India.
Landlessness
Mostly landless SC households rely on sons for wage income and old-age support, and clinics in the plains make sex selection easier.
This model answer is indicative and the model can make mistakes; please verify key facts independently.
Practise this question
1Get the answer sheet
Sized for this question.
2Write your answer
Timed, by hand.
3Get it marked
Your score and what to fix.
This chapter in the exam
Role of women and women's organization13 questions
Asked in 8 of 14 sittings since 2013
- 2024Distinguish between gender equality, gender equity and women's empowerment. Why is it important to take gender concerns into account in programme design and implementation?
- 2024Globalization has increased urban migration by skilled, young, unmarried women from various classes. How has this trend impacted upon their personal freedom and relationship with family?
All 13 questions, sorted by sub-topic, with model answers and practice.
Question from the official UPSC Civil Services (Main) Examination 2015 paper. Answer written by Ghissu's engine and checked against our editorial standards. Found an error? Tell us and we correct it within 48 hours.