2020 · GS Paper 1 · Q17 · 15 marks
Examine the status of forest resources of India and its resultant impact on climate change.
In short
India's forest and tree cover is growing slowly but remains thin in quality, which limits its role as a carbon sink and climate buffer. ISFR 2023 recorded cover at 25.17% of India's area and an additional carbon sink of 2.29 billion tonnes since 2005.
Model answer
Ghissu Editorial · Verified 4 Oct 2026 · 275 words
Slow gains in extent
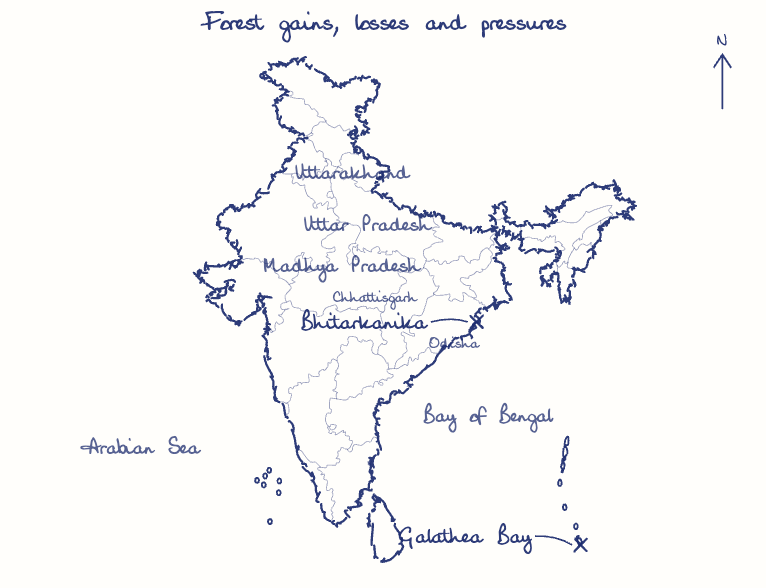
Cover grew by 1,445.81 sq km over 2021, led by Chhattisgarh, Uttar Pradesh and Odisha, largely through plantations and trees outside forests.
Thin quality
Very dense forest is only about 3% of the area, and the North-East lost 327.30 sq km of forest in ISFR 2023.
Pressures
Diversion for projects such as Great Nicobar, jhum, fires and invasive Lantana erode the stock.
Carbon sink
ISFR 2023 put the additional sink since 2005 at 2.29 billion tonnes of CO2 equivalent, against the NDC target of 2.5-3 billion tonnes by 2030.
Adaptation buffer
Villages behind the Bhitarkanika mangroves suffered fewer deaths in the 1999 Odisha super cyclone, and hill forests regulate rainfall and slopes.
Feedback risk
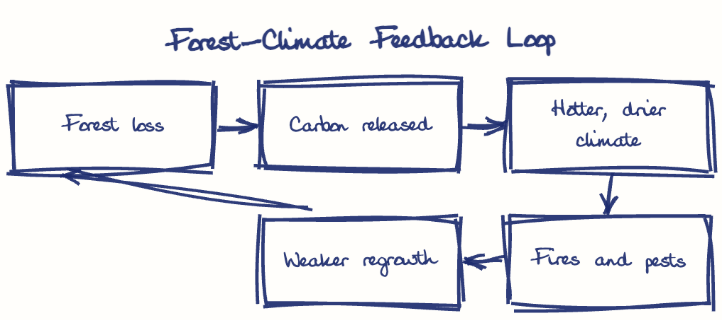
Degraded forests turn from sinks into sources, and warming raises fires and pests.
Restore quality
Steer CAMPA funds and the Green India Mission towards native-species restoration of degraded forest.
Community and coasts
Use community forest rights under the Forest Rights Act, 2006, and expand MISHTI for mangroves.
This model answer is indicative and the model can make mistakes; please verify key facts independently.
Practise this question
1Get the answer sheet
Sized for this question.
2Write your answer
Timed, by hand.
3Get it marked
Your score and what to fix.
This chapter in the exam
Climate, Vegetation and Soils3 questions
Asked in 3 of 14 sittings since 2013
Question from the official UPSC Civil Services (Main) Examination 2020 paper. Answer written by Ghissu's engine and checked against our editorial standards. Found an error? Tell us and we correct it within 48 hours.