2024 · GS Paper 3 · Q1 · 10 marks
Examine the pattern and trend of public expenditure on social services in the post-reforms period in India. To what extent this has been in consonance with achieving the objective of inclusive growth?
In short
Social services spending stagnated in the 1990s, expanded through rights-based entitlements in the 2000s and rose to 7.8% of GDP in 2023-24 (BE), but it has served inclusive growth only partly. Multidimensional poverty fell from 55.3% in 2005-06 to 14.96% in 2019-21.
Model answer
Ghissu Editorial · Verified 4 Oct 2026 · 292 words
Compression then entitlements
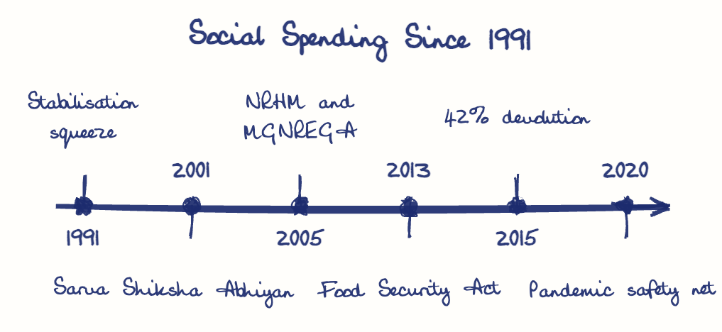
Spending stayed flat in the 1990s under fiscal stabilisation, then rights-based laws such as MGNREGA, the RTE Act 2009 and the NFSA 2013 expanded it.
States and assets
After 42% devolution in 2015, states gained untied funds while the Centre funded toilets, houses, tap water and LPG and widened DBT.
Composition
Health spending grew at a CAGR of 15.8% between FY18 and FY24 against 9.4% for education.
Deprivation down
NITI Aayog's MPI fell from 55.3% in 2005-06 to 14.96% in 2019-21, and out-of-pocket health spending fell from 62.6% of the total in 2014-15 to 39.4% in 2021-22 (National Health Accounts).
Benchmarks missed
Health and education spending remain below the 2.5% and 6% of GDP goals of the National Health Policy 2017 and NEP 2020, and ASER shows weak foundational reading.
Uneven reach
Per-head spending is lowest in high-poverty states such as Bihar, and MGNREGA wage delays persist.
This model answer is indicative and the model can make mistakes; please verify key facts independently.
Practise this question
1Get the answer sheet
Sized for this question.
2Write your answer
Timed, by hand.
3Get it marked
Your score and what to fix.
This chapter in the exam
Indicators & Measurement2 questions
Asked in 2 of 14 sittings since 2013
Question from the official UPSC Civil Services (Main) Examination 2024 paper. Answer written by Ghissu's engine and checked against our editorial standards. Found an error? Tell us and we correct it within 48 hours.