Analyse the composition and spatial distribution of Scheduled Castes (SCs), Scheduled Tribes (STs), and religious communities in Andhra Pradesh, as per Census 2011.
In short
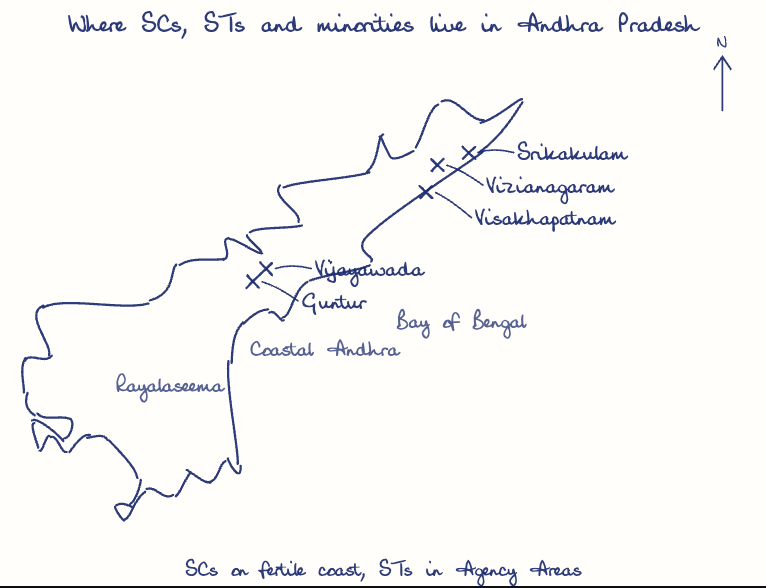
Census 2011 shows Scheduled Castes at 17.08% of Andhra Pradesh's population, concentrated in fertile coastal districts, Scheduled Tribes at 5.53% in the hilly Agency Areas, and a Hindu majority with Muslims clustered in Rayalaseema and towns. East Godavari has the largest SC population, about 9.57 lakh.
Model answer
Ghissu Editorial · Verified 4 Oct 2026 · 253 words
SC Population and District Concentration
SCs constitute 17.08% of the population, with highest numbers in East Godavari (9.57 lakh) and Guntur districts, and lowest in Vizianagaram, reflecting uneven spatial distribution. Their socio-economic profile is marked by landless agricultural labor and artisan activities, with a favorable sex ratio of 1007 females per 1000 males but lower literacy rates than the general population.
ST Population and Tribal Groups
STs make up 5.53% of the population, mainly in Agency Areas of Visakhapatnam, Srikakulam, East Godavari, inhabited by tribes like Konda Dora, Koya, and Yerukala. These tribes show linguistic diversity within the Dravidian family and predominantly identify as Hindus (98.9%), with small Christian and Muslim minorities, reflecting religious assimilation.
Spatial Distribution of SCs
SCs are densely settled in coastal districts East Godavari, West Godavari, Guntur due to agricultural labor demand, with lower presence in Vizianagaram and Rayalaseema; urban migration to Greater Visakhapatnam and Vijayawada is notable. This uneven distribution calls for region-specific welfare schemes to address local needs effectively.
This model answer is indicative and the model can make mistakes; please verify key facts independently.
Practise this question
1Get the answer sheet
Sized for this question.
2Write your answer
Timed, by hand.
3Get it marked
Your score and what to fix.
This chapter in the exam
Social Geography5 questions
Asked in 3 of 8 sittings since 2008
Most tested: Census-based composition and spatial distribution of Andhra Pradesh’s socially significant population groups
- 2023What are different types of rural settlements and factors affecting them ? Add a note on rural settlement patterns in India.
- 2023Give a description of the 'demographic dividend' in the Indian context.
All 5 questions, sorted by sub-topic, with model answers and practice.
Question from the official APPSC Group-I Mains 2025 paper. Answer written by Ghissu's engine and checked against our editorial standards. Found an error? Tell us and we correct it within 48 hours.