2015 · GS Paper 2 · Q13 · 12 marks
Though there have been several different estimates of poverty in India, all indicate reduction in poverty levels over time. Do you agree? Critically examine with reference to urban and rural poverty indicators.
In short
Every major estimate, from the Tendulkar and Rangarajan lines to NITI Aayog's MPI, shows rural and urban poverty falling, though they differ sharply on its level. On the Tendulkar line, rural poverty fell from 41.8% to 25.7% and urban poverty from 25.7% to 13.7% between 2004-05 and 2011-12.
Model answer
Ghissu Editorial · Verified 4 Oct 2026 · 296 words
Consumption lines
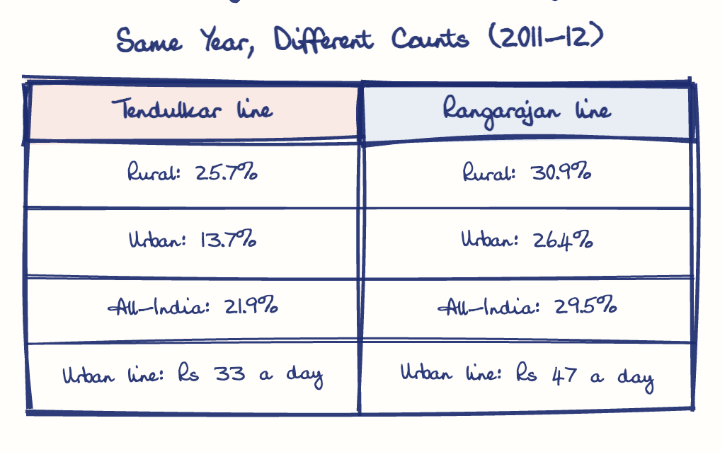
On the Tendulkar line, rural poverty fell from 41.8% (2004-05) to 25.7% (2011-12) and urban poverty from 25.7% to 13.7%.
Multidimensional index
NITI Aayog's National MPI (2023) shows rural poverty falling from 32.59% (2015-16) to 19.28% (2019-21) and urban poverty from 8.65% to 5.27%.
Spending and global lines
HCES 2022-23 shows the urban-rural spending gap narrowing from 84% to 71%, and the World Bank (2025) finds rural extreme poverty down from 18.4% to 2.8% and urban from 10.7% to 1.1%.
Line decides level
Urban poverty nearly doubles under the Rangarajan line because it counts rent and conveyance.
Hidden urban poverty
The Hashim Committee (2012) urged a vulnerability-based count, since many of the 6.5 crore slum dwellers (Census 2011) face deprivation a spending line misses.
Fragile gains
The State of Working India 2021 estimated that 23 crore people slipped below the minimum wage threshold in the pandemic, and NFHS-5 (2019-21) still found 35.5% of children stunted.
This model answer is indicative and the model can make mistakes; please verify key facts independently.
Practise this question
1Get the answer sheet
Sized for this question.
2Write your answer
Timed, by hand.
3Get it marked
Your score and what to fix.
This chapter in the exam
Poverty4 questions
Asked in 4 of 14 sittings since 2013
- 2025Inequality in the ownership pattern of resources is one of the major causes of poverty. Discuss in the context of 'paradox of poverty'.
- 2020"The incidence and intensity of poverty are more important in determining poverty based on income alone". In this context analyse the latest United Nations Multidimensional Poverty Index Report.
All 4 questions, sorted by sub-topic, with model answers and practice.
Question from the official UPSC Civil Services (Main) Examination 2015 paper. Answer written by Ghissu's engine and checked against our editorial standards. Found an error? Tell us and we correct it within 48 hours.