2015 · GS Paper 3 · Q9 · 12 marks
To what factors can the recent dramatic fall in equipment costs and tariff of solar energy be attributed ? What implications does the trend have for the thermal power producers and the related industry ?
In short
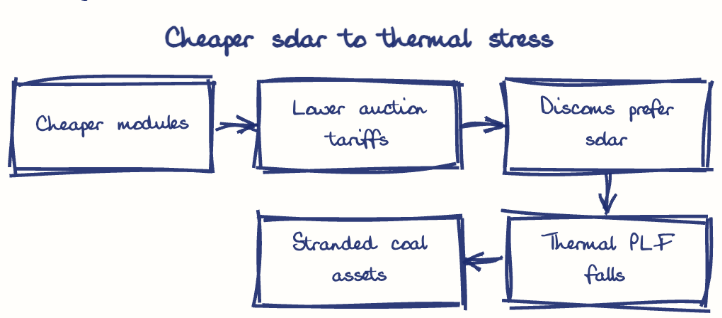
The fall in solar costs and tariffs came from a global fall in module prices, Chinese scale and Indian reverse auctions and solar parks, and it has pushed thermal power from baseload to costly back-up. Tariffs fell to Rs 2.15 per unit by 2024-25.
Model answer
Ghissu Editorial · Verified 4 Oct 2026 · 269 words
Learning curve
Module prices fell about 80% between 2009 and 2015 (IRENA) as polysilicon gluts, scale and higher cell efficiency cut costs.
Chinese overcapacity
Huge Chinese factories pushed module prices down, and Indian developers imported cheaply until the 2018 safeguard duty.
Policy-driven scale
The 100 GW solar target, SECI reverse auctions and solar parks such as Bhadla and Kurnool reduced land and evacuation risk for developers.
Cheaper finance
Twenty-five-year PPAs, SECI's payment security and green bonds lowered the cost of capital.
Stressed assets
The Standing Committee on Energy (2018) found 34 thermal projects of about 40 GW under stress.
Balancing role
Coal plants now ramp for the evening peak, and CEA rules require flexible operation down to 40% load.
Industry ripple
Coal India, railway coal freight, BHEL's orders and bank loans to power face a squeeze, prompting NTPC and Coal India to enter solar.
This model answer is indicative and the model can make mistakes; please verify key facts independently.
Practise this question
1Get the answer sheet
Sized for this question.
2Write your answer
Timed, by hand.
3Get it marked
Your score and what to fix.
This chapter in the exam
Developments, Applications and Effects in Everyday Life23 questions
Asked in 13 of 14 sittings since 2013
- 2026Distinguish between a Fast Breeder Reactor (FBR) and a thermal nuclear reactor. In the context of first indigenously developed prototype FBR at Kalpakkam, explain the term 'criticality'. What are its implications for clean energy future of our country? (Answer in 150 words)
- 2025How can India achieve energy independence through clean technology by 2047 ? How can biotechnology play a crucial role in this endeavour ?
All 23 questions, sorted by sub-topic, with model answers and practice.
Question from the official UPSC Civil Services (Main) Examination 2015 paper. Answer written by Ghissu's engine and checked against our editorial standards. Found an error? Tell us and we correct it within 48 hours.