2015 · GS Paper 1 · Q11 · 12 marks
Discuss the changes in the trends of labour migration within and outside India in the last four decades.
In short
Over four decades, internal migration tilted from female marriage migration, still the largest stream, towards male rural-to-urban work migration on new interstate corridors, while emigration moved from Gulf semi-skilled labour to skilled global flows. India became the largest remittance recipient, about USD 120 billion in 2023 (World Bank).
Model answer
Ghissu Editorial · Verified 4 Oct 2026 · 288 words
From marriage to work
Rural-to-rural female migration for marriage is still the largest stream, but after 1991, male rural-to-urban migration for construction, manufacturing and services grew fastest.
Interstate surge
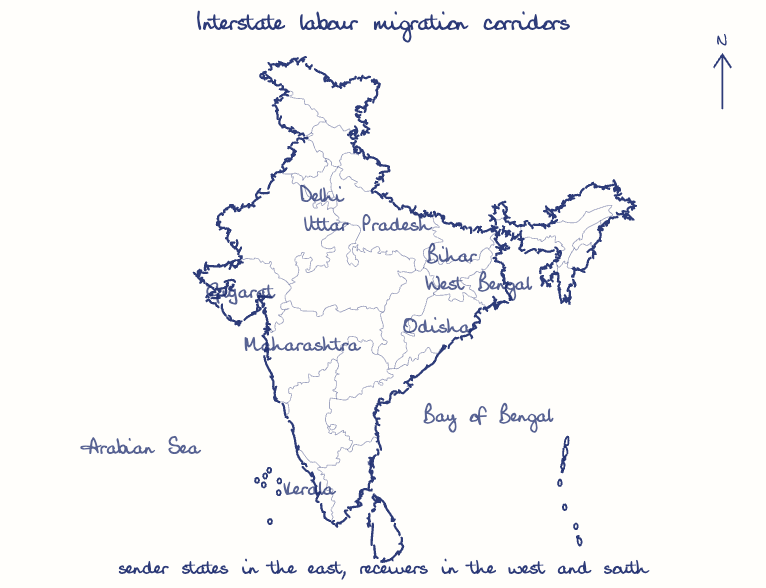
The Economic Survey 2016-17 estimated about 9 million interstate migrants a year (2011-16), on new corridors from Uttar Pradesh, Bihar and Odisha to Maharashtra, Gujarat, Delhi and Kerala.
Circular and informal
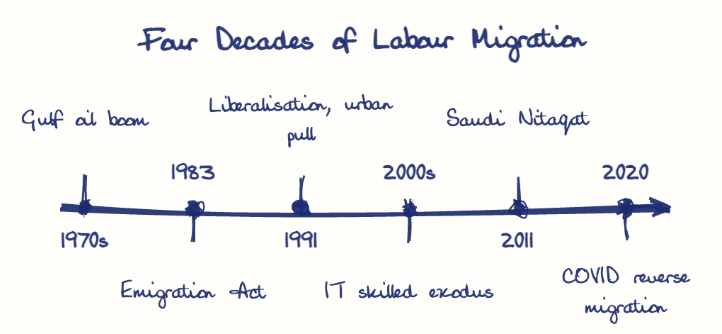
Seasonal work in brick kilns and building sites dominates, and the 2020 lockdown exposed it, prompting One Nation One Ration Card and e-Shram (2021).
Gulf to global
The 1970s oil boom drew Kerala's semi-skilled workers to the GCC, which still hosts over nine million Indians, while the 1990s IT boom sent engineers, doctors and students to the US, UK and Canada.
Wider base, new shocks
Uttar Pradesh and Bihar joined Kerala as sources, while Saudi Arabia's Nitaqat policy (2011) caused return waves.
Remittance power
India is the largest remittance recipient, at about USD 120 billion in 2023 (World Bank).
This model answer is indicative and the model can make mistakes; please verify key facts independently.
Practise this question
1Get the answer sheet
Sized for this question.
2Write your answer
Timed, by hand.
3Get it marked
Your score and what to fix.
This chapter in the exam
Population and associated issues5 questions
Asked in 4 of 14 sittings since 2013
- 2026Critically examine the challenges of demographic transition in contemporary India.
- 2021Discuss the main objectives of Population Education and point out the measures to achieve them in India in detail.
All 5 questions, sorted by sub-topic, with model answers and practice.
Question from the official UPSC Civil Services (Main) Examination 2015 paper. Answer written by Ghissu's engine and checked against our editorial standards. Found an error? Tell us and we correct it within 48 hours.