2015 · GS Paper 3 · Q16 · 12 marks
The frequency of earthquakes appears to have increased in the Indian subcontinent. However, India's preparedness for mitigating their impact has significant gaps. Discuss various aspects.
In short
Earthquakes appear more frequent because detection has improved, Himalayan strain is building and exposure is rising, while India's preparedness lags on building codes, lifelines, microzonation and last-mile response. Seismic observatories rose from 80 in 2014 to 168 by February 2025, yet most houses remain non-engineered.
Model answer
Ghissu Editorial · Verified 4 Oct 2026 · 285 words
Better detection
Seismic observatories rose from 80 in 2014 to 168 by February 2025 (PIB), so small tremors once missed are now recorded.
Stored Himalayan strain
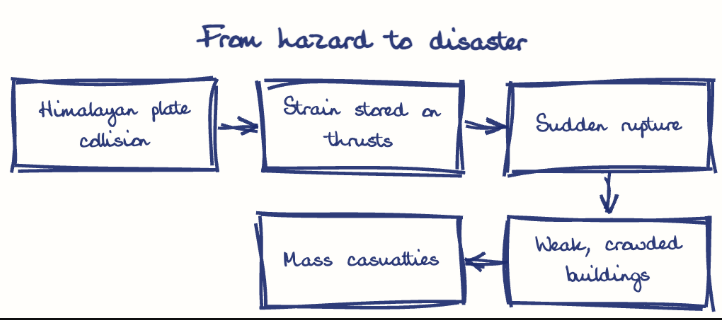
Roger Bilham's "central seismic gap" between the 1905 Kangra and 1934 Bihar-Nepal ruptures still holds unreleased strain.
Greater exposure
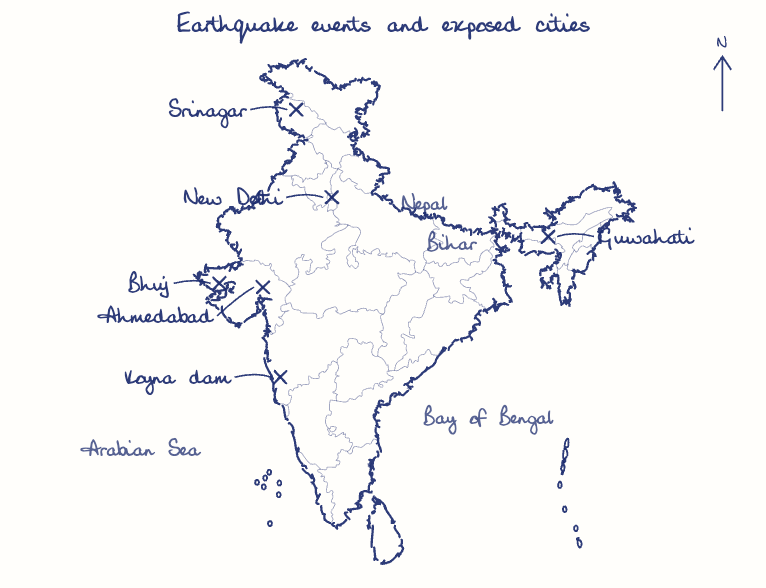
Unplanned growth of towns in Zones IV and V, from Delhi to Guwahati, means the same tremor now hits far more people.
Weak code enforcement
IS 1893 and the National Building Code exist, but most houses are non-engineered, as the Ahmedabad collapses in the 2001 Bhuj earthquake revealed.
Unsafe lifelines
Bhuj's civil hospital collapsed in 2001, and few hospitals, schools and bridges have since been retrofitted.
Thin risk knowledge
Seismic microzonation is complete for only a few cities such as Delhi, Guwahati and Bengaluru.
Last-mile response
The NDRF (2006) leads rescue, but trained masons, school drills and early warning remain scarce; Uttarakhand's IIT Roorkee alert system came only in 2021.
This model answer is indicative and the model can make mistakes; please verify key facts independently.
Practise this question
1Get the answer sheet
Sized for this question.
2Write your answer
Timed, by hand.
3Get it marked
Your score and what to fix.
This chapter in the exam
Earthquakes & Tsunamis3 questions
Asked in 3 of 14 sittings since 2013
- 2021Discuss about the vulnerability of India to earthquake related hazards. Give examples including the salient features of major disasters caused by earthquakes in different parts of India during the last three decades.
- 2017On December 2004, tsunami brought havoc on fourteen countries including India. Discuss the factors responsible for occurrence of tsunami and its effects on life and economy. In the light of guidelines of NDMA (2010) describe the mechanisms for preparedness to reduce the risk during such events.
Question from the official UPSC Civil Services (Main) Examination 2015 paper. Answer written by Ghissu's engine and checked against our editorial standards. Found an error? Tell us and we correct it within 48 hours.