2017 · GS Paper 1 · Q14 · 15 marks
Account for variations in oceanic salinity and discuss its multi-dimensional effects.
In short
Ocean salinity varies with evaporation, rainfall, river inflow, ice formation and circulation, from under 10 parts per thousand in the Baltic to about 40 in the Red Sea. Through density it drives the thermohaline conveyor and shapes cyclones, marine life and salt economies.
Model answer
Ghissu Editorial · Verified 4 Oct 2026 · 271 words
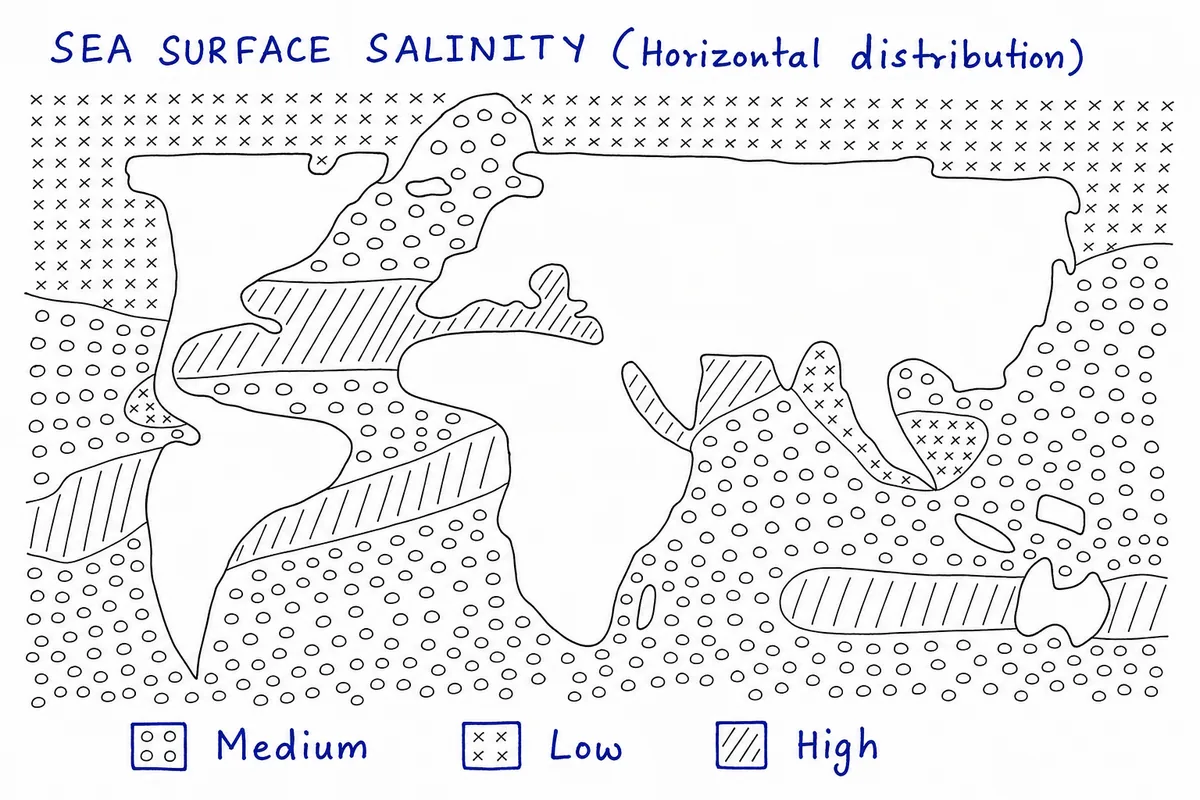
Evaporation versus precipitation
Salinity peaks in the subtropical high-pressure belts, where evaporation is highest, but dips at the rainy equator.
River inflow and ice
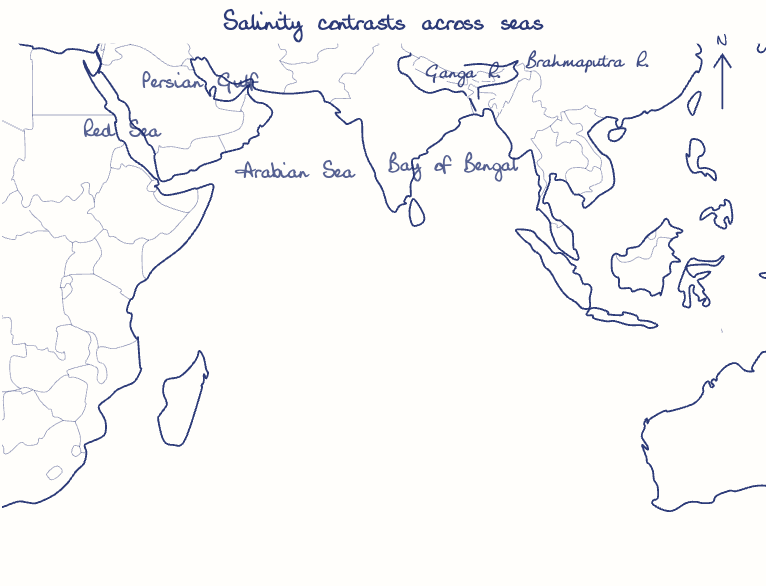
The Ganga and Brahmaputra make the Bay of Bengal less saline than the Arabian Sea, while ice formation raises salinity and melting lowers it in polar seas.
Enclosure and circulation
Enclosed desert seas like the Red Sea stay highly saline, while currents mix basins and a halocline marks change with depth.
Circulation and climate
Dense, salty North Atlantic water drives the thermohaline conveyor, which the IPCC's Sixth Assessment Report expects to weaken as meltwater freshens the surface.
Cyclones
The Bay of Bengal's freshwater cap keeps the surface warm, helping cyclones like Amphan (2020) intensify.
Marine life and economy
Corals need narrow salinity bands and Sundarbans mangroves are zoned by it, while Gujarat's saline coast yields most of India's salt.
Monitor and forecast
Expand Argo floats under INCOIS and satellites like SMOS and SMAP, and feed the data into IMD cyclone models.
Manage brine and warming
Regulate desalination brine and cut emissions to slow Atlantic freshening.
This model answer is indicative and the model can make mistakes; please verify key facts independently.
Practise this question
1Get the answer sheet
Sized for this question.
2Write your answer
Timed, by hand.
3Get it marked
Your score and what to fix.
This chapter in the exam
Water (Oceans)4 questions
Asked in 4 of 14 sittings since 2013
- 2022What are the forces that influence ocean currents? Describe their role in fishing Industry of the world.
- 2019How do ocean currents and water masses differ in their impacts on marine life and coastal environment? Give suitable examples.
All 4 questions, sorted by sub-topic, with model answers and practice.
Question from the official UPSC Civil Services (Main) Examination 2017 paper. Answer written by Ghissu's engine and checked against our editorial standards. Found an error? Tell us and we correct it within 48 hours.