2021 · GS Paper 1 · Q5 · 10 marks
Despite India being one of the countries of the Gondwanaland, its mining industry contributes much less to its Gross Domestic Product (GDP) in percentage. Discuss.
In short
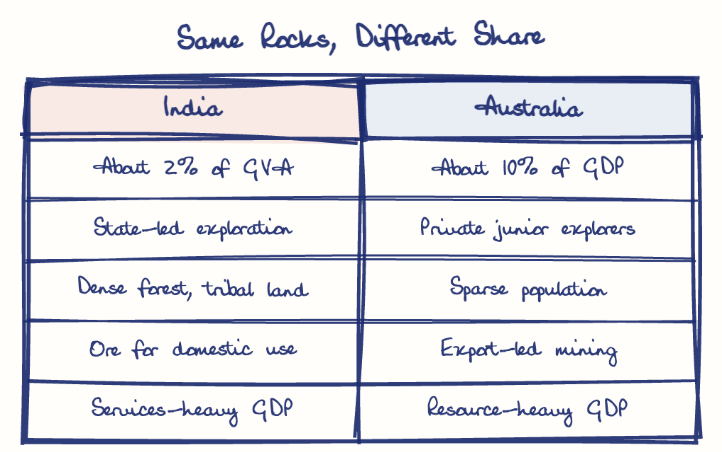
India's mining share stays near 2% of GVA despite its Gondwana geology because exploration is thin, allotment scandals and forest-tribal clearances stall projects, and processed value is booked as manufacturing. The 2015 auction reform and the 2025 National Critical Mineral Mission aim to close this gap.
Model answer
Ghissu Editorial · Verified 4 Oct 2026 · 294 words
Exploration deficit
Only a fraction of about 6.88 lakh sq km of Obvious Geological Potential has been explored in detail, leaving deep-seated and critical minerals unmapped.
Governance shocks
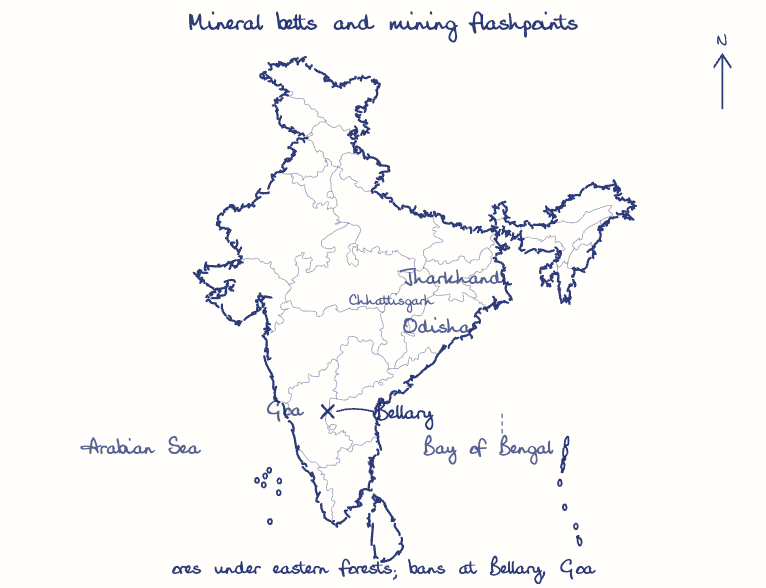
Illegal mining under first-come-first-served allotment led to the Bellary (2011) and Goa (2012) bans and the cancellation of 214 coal blocks in Manohar Lal Sharma (2014).
Land and consent
Ores lie under forests and Fifth Schedule areas, where clearances, the Samatha (1997) ruling and the Niyamgiri verdict (2013) lengthen gestation.
Value captured elsewhere
High-ash coal and low-grade ore fetch little, and processing into steel or aluminium is counted as manufacturing.
Auctions and funds
The MMDR Amendment of 2015 mandated auctions and set up District Mineral Foundations; the 2021 amendment ended the captive and merchant distinction.
Critical minerals
Exploration licences (2023) and the National Critical Mineral Mission (2025) target lithium and rare earths, while commercial coal auctions helped output cross one billion tonnes in 2024-25.
This model answer is indicative and the model can make mistakes; please verify key facts independently.
Practise this question
1Get the answer sheet
Sized for this question.
2Write your answer
Timed, by hand.
3Get it marked
Your score and what to fix.
This chapter in the exam
Resources and planning38 questions
Asked in 14 of 14 sittings since 2013
- 2026"Water resources are both an asset and a source of conflict in South Asia." Examine this statement giving examples.
- 2026Analyze the role of satellite-based technologies in achieving climate-smart agriculture and food security in India.
All 38 questions, sorted by sub-topic, with model answers and practice.
Question from the official UPSC Civil Services (Main) Examination 2021 paper. Answer written by Ghissu's engine and checked against our editorial standards. Found an error? Tell us and we correct it within 48 hours.