2021 · GS Paper 3 · Q11 · 15 marks
Do you agree that the Indian economy has recently experienced V-shaped recovery ? Give reasons in support of your answer.
In short
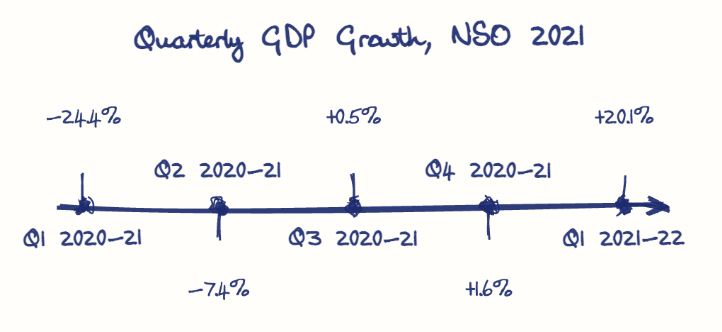
India's recovery was V-shaped in quarterly growth rates but closer to a K in its spread, and incomplete in output levels and jobs. Growth of 20.1% in April-June 2021 left real GDP still about 9% below its April-June 2019 level.
Model answer
Ghissu Editorial · Verified 4 Oct 2026 · 289 words
Swift turnaround
Growth turned positive by October-December 2020, only two quarters after the trough.
Strong indicators
GST collections stayed above Rs 1 lakh crore a month from October 2020 to March 2021, and the manufacturing PMI hit 58.9 in October 2020.
Resilient pillars
Agriculture grew about 3.6%, FDI reached a record of about $82 billion in 2020-21, and reserves crossed $600 billion in June 2021.
Base effect
Real GDP in April-June 2021 was still about 9% below April-June 2019.
Second wave
The Delta wave forced fresh lockdowns, and RBI's consumer confidence index fell to a record low of 48.5 in May 2021.
K-shaped divergence
Listed firms and the Sensex boomed while MSMEs, informal workers and contact-intensive services lagged.
Lasting scars
The RBI's Report on Currency and Finance 2021-22 put output losses above Rs 50 lakh crore, recoverable only by 2034-35.
Broad-based revival
Sustained public capex and PLI schemes to crowd in private investment, guaranteed credit for MSMEs and e-Shram-linked support for informal workers can widen the recovery.
This model answer is indicative and the model can make mistakes; please verify key facts independently.
Practise this question
1Get the answer sheet
Sized for this question.
2Write your answer
Timed, by hand.
3Get it marked
Your score and what to fix.
This chapter in the exam
Growth8 questions
Asked in 6 of 14 sittings since 2013
- 2024Discuss the merits and demerits of the four 'Labour Codes' in the context of labour market reforms in India. What has been the progress so far in this regard?
- 2024What are the causes of persistent high food inflation in India? Comment on the effectiveness of the monetary policy of the RBI to control this type of inflation.
All 8 questions, sorted by sub-topic, with model answers and practice.
Question from the official UPSC Civil Services (Main) Examination 2021 paper. Answer written by Ghissu's engine and checked against our editorial standards. Found an error? Tell us and we correct it within 48 hours.