2021 · GS Paper 3 · Q1 · 10 marks
Explain the difference between computing methodology of India's Gross Domestic Product (GDP) before the year 2015 and after the year 2015.
In short
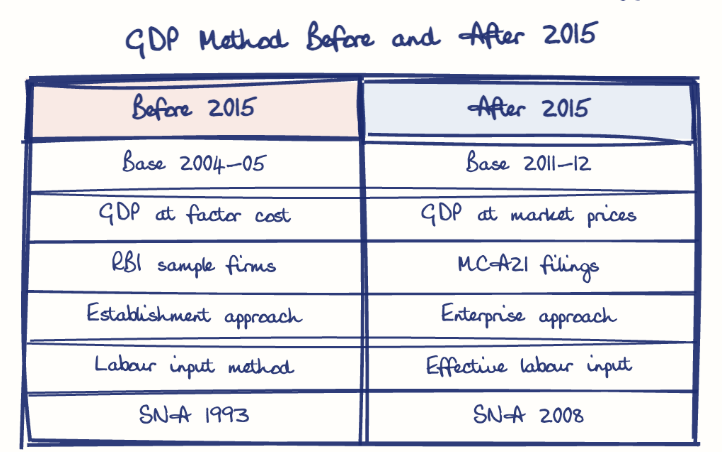
After 2015 India measured headline growth as GDP at market prices on a 2011-12 base, using MCA21 corporate filings and an enterprise approach instead of factor-cost GDP and an RBI company sample. The change raised 2013-14 growth from 4.7% to 6.9%.
Model answer
Ghissu Editorial · Verified 4 Oct 2026 · 304 words
Headline measure
GDP at factor cost gave way to GDP at market prices, with sectors measured as gross value added at basic prices.
Corporate data
An RBI study of about 2,500 companies was replaced by the filed accounts of over 5 lakh companies in the MCA21 database.
Enterprise approach
Factory-level measurement through the Annual Survey of Industries gave way to firm-level measurement that also captures marketing and head-office value added.
Informal sector
The effective labour input method weights owners, hired workers and helpers differently, and financial sector coverage widened.
Revised growth
Growth for 2013-14 rose from 4.7% to 6.9% despite weak credit and investment.
Overestimation debate
Arvind Subramanian argued in 2019 that growth in 2011-12 to 2016-17 was overstated by about 2.5 percentage points a year, which the PM's Economic Advisory Council rebutted.
Data quality
An NSSO survey found about 38.7% of sampled MCA21 companies out of coverage or untraceable.
This model answer is indicative and the model can make mistakes; please verify key facts independently.
Practise this question
1Get the answer sheet
Sized for this question.
2Write your answer
Timed, by hand.
3Get it marked
Your score and what to fix.
This chapter in the exam
Growth8 questions
Asked in 6 of 14 sittings since 2013
- 2024Discuss the merits and demerits of the four 'Labour Codes' in the context of labour market reforms in India. What has been the progress so far in this regard?
- 2024What are the causes of persistent high food inflation in India? Comment on the effectiveness of the monetary policy of the RBI to control this type of inflation.
All 8 questions, sorted by sub-topic, with model answers and practice.
Question from the official UPSC Civil Services (Main) Examination 2021 paper. Answer written by Ghissu's engine and checked against our editorial standards. Found an error? Tell us and we correct it within 48 hours.