2022 · GS Paper 1 · Q7 · 10 marks
Examine the potential of wind energy in India and explain the reasons for their limited spatial spread.
In short
India's wind potential, about 1,164 GW at 150 m hub height per NIWE, is barely tapped and confined to eight western and southern states because of local wind regimes, bustard habitat limits, a thin grid and tight auction tariffs. Installed capacity stood at 47.96 GW in November 2024.
Model answer
Ghissu Editorial · Verified 4 Oct 2026 · 282 words
Onshore resource
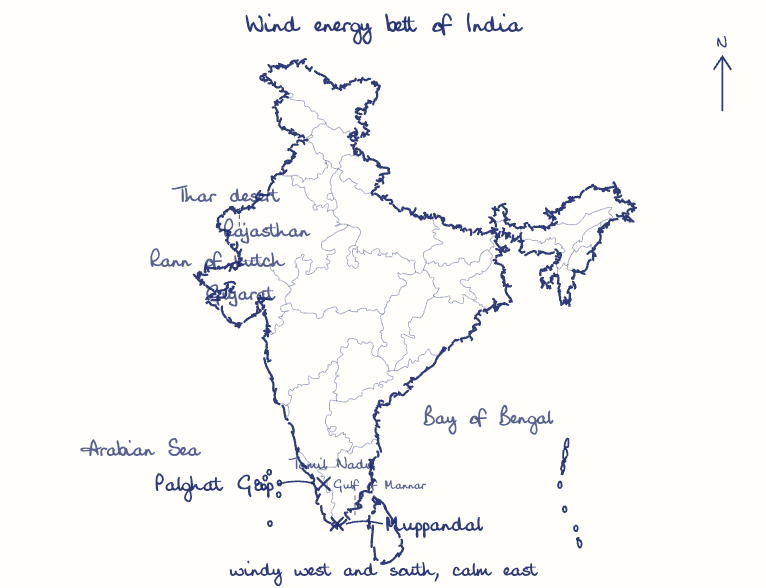
NIWE estimates about 695 GW at 120 m and 1,164 GW at 150 m, led by Gujarat, Rajasthan, Tamil Nadu and Karnataka.
Offshore frontier
About 70 GW is identified off Gujarat and the Gulf of Mannar, with 2024 viability gap funding for the first 1 GW.
Complement to solar
Wind peaks in monsoon and evening hours, making hybrids under the 2018 policy useful for round-the-clock power.
Physical geography
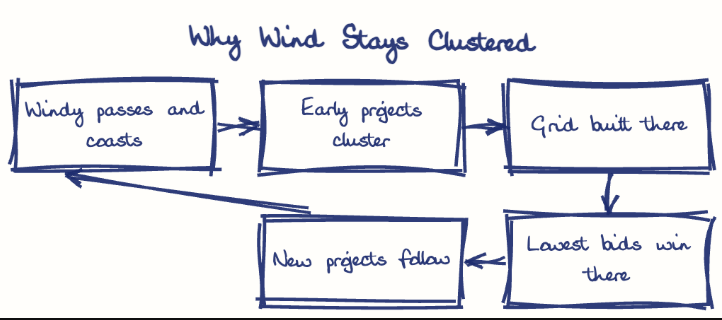
Strong, steady winds occur where gaps such as Palghat and Aralvaimozhi funnel the monsoon, or along the Kutch coast and in the Thar; the Gangetic plain is calm.
Ecology and land
The Supreme Court's 2021 Great Indian Bustard order on power lines in Rajasthan and Gujarat slowed projects.
Grid limits
Evacuation lines and the Green Energy Corridor exist only around windy pockets, and Tamil Nadu often curtails wind power.
Auction economics
Reverse auctions since 2017 drove tariffs near ₹2.43 per unit, so only the windiest sites can bid.
This model answer is indicative and the model can make mistakes; please verify key facts independently.
Practise this question
1Get the answer sheet
Sized for this question.
2Write your answer
Timed, by hand.
3Get it marked
Your score and what to fix.
This chapter in the exam
Resources and planning38 questions
Asked in 14 of 14 sittings since 2013
- 2026"Water resources are both an asset and a source of conflict in South Asia." Examine this statement giving examples.
- 2026Analyze the role of satellite-based technologies in achieving climate-smart agriculture and food security in India.
All 38 questions, sorted by sub-topic, with model answers and practice.
Question from the official UPSC Civil Services (Main) Examination 2022 paper. Answer written by Ghissu's engine and checked against our editorial standards. Found an error? Tell us and we correct it within 48 hours.