2023 · GS Paper 3 · Q13 · 15 marks
Explain the changes in cropping pattern in India in the context of changes in consumption pattern and marketing conditions.
In short
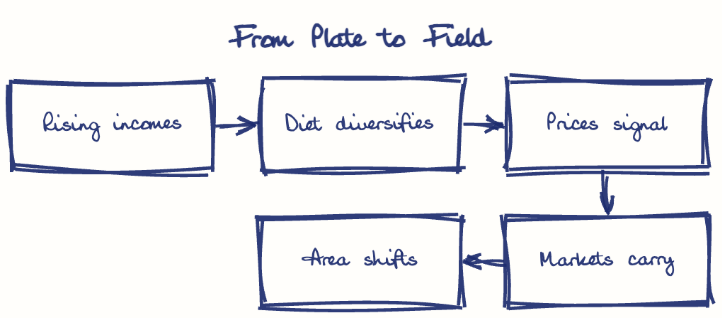
India's cropping pattern is shifting from cereals towards horticulture, feed crops, millets and oilseeds as diets diversify, while procurement bias, new market channels, exports and cold chains shape how far it moves. Horticulture output reached 362.08 million tonnes in 2024-25.
Model answer
Ghissu Editorial · Verified 4 Oct 2026 · 267 words
Horticulture, feed and fodder
Horticulture output rose from 280.70 million tonnes in 2013-14 to 362.08 million tonnes in 2024-25 (PIB, 2026), and milk, poultry and ethanol demand have pulled area into maize and soybean.
Millets revive, oilseeds lag
The International Year of Millets (2023) lifted millet output to 180.15 lakh tonnes in 2024-25, while India still imports over half its edible oil, prompting the oilseed and oil palm missions.
Procurement and channels
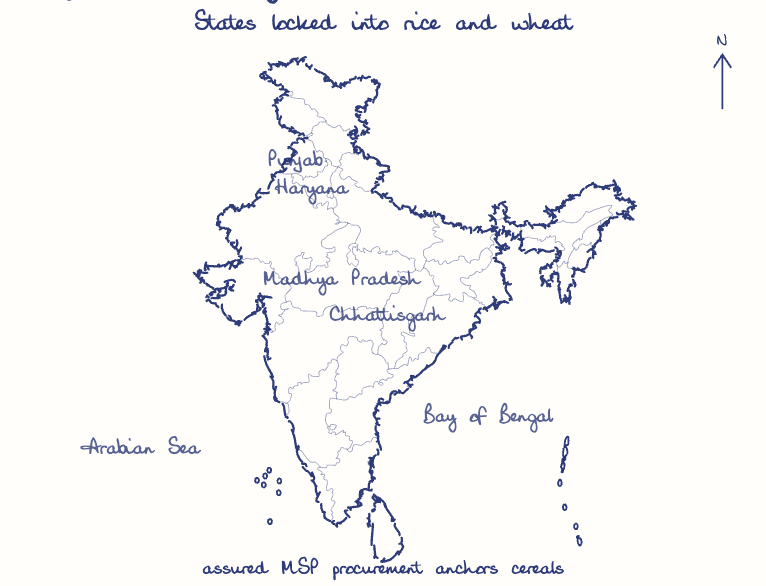
Assured MSP procurement keeps Punjab and Haryana locked in rice and wheat, while e-NAM, FPOs and PepsiCo-style potato contracts steer some area elsewhere.
Exports and storage
Agri exports reached USD 51.1 billion in FY25, rewarding basmati and spices, though curbs like the 2023 rice export ban and thin cold chains deter shifts.
Align incentives
Procure pulses and oilseeds under PM-AASHA and millets for the PDS, keep export policy stable and fund horticulture cold chains through the Agriculture Infrastructure Fund.
This model answer is indicative and the model can make mistakes; please verify key facts independently.
Practise this question
1Get the answer sheet
Sized for this question.
2Write your answer
Timed, by hand.
3Get it marked
Your score and what to fix.
This chapter in the exam
Major Crops and Cropping Patterns10 questions
Asked in 10 of 14 sittings since 2013
- 2026How Indian agriculture has been transformed from food scarcity to food surplus level? Explain the various government policies implemented for diversification of Indian agriculture. (Answer in 250 words)
- 2025Explain the factors influencing the decision of the farmers on the selection of high value crops in India.
All 10 questions, sorted by sub-topic, with model answers and practice.
Question from the official UPSC Civil Services (Main) Examination 2023 paper. Answer written by Ghissu's engine and checked against our editorial standards. Found an error? Tell us and we correct it within 48 hours.