What is relative poverty ? What are the reasons for its presence in India ? Explain the Gini-coefficient and Lorenz curve methods of measuring relative poverty.
In short
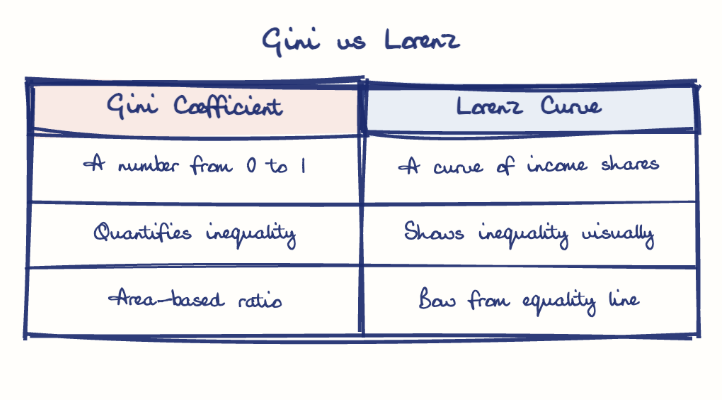
Relative poverty is having far less income or resources than society's average, persisting in India through unequal growth, regional gaps, social exclusion and weak public services. The Lorenz curve plots cumulative income against population, and the Gini coefficient (0 to 1) measures its gap from equality.
Model answer
Ghissu Editorial · Verified 4 Oct 2026 · 255 words
Concept and Capability Approach
Relative poverty means having less income/resources than societal average, limiting social participation; Amartya Sen’s capability approach frames it as deprivation of freedoms beyond income, including health and education, emphasizing multidimensional well-being.
India’s Context and Social Exclusion
Despite growth, disparities persist; relative poverty captures inequalities in access and opportunity across regions and social groups, with marginalized communities like Scheduled Tribes and Castes facing higher multidimensional poverty rates.
Unequal Wealth Distribution
Top 10% control ~77% of wealth; bottom 50% share only 13%, perpetuating inequality and limiting upward mobility.
Regional and Social Disparities
Andhra Pradesh shows 9.24% GSDP growth but rural pockets remain poor; Scheduled Tribes face 50.6% multidimensional poverty; health infrastructure gaps include 22% medical officer vacancies and only 175 CHCs vs. 412 needed, restricting essential services.
Gini-Coefficient
Measures income inequality2 from 0 to 1; India’s Gini fell from 28.8 (2011) to 25.5 (2022-23), indicating modest inequality reduction; wealth concentration remains high with top 1% owning 40% of wealth; informs welfare schemes like Jan Dhan Yojana (55 crore accounts) promoting financial inclusion.
This model answer is indicative and the model can make mistakes; please verify key facts independently.
Practise this question
1Get the answer sheet
Sized for this question.
2Write your answer
Timed, by hand.
3Get it marked
Your score and what to fix.
This chapter in the exam
Inclusive Growth: India and AP schemes49 questions
Asked in 8 of 8 sittings since 2008
Most tested: Women empowerment and poverty reduction through AP welfare and credit-linked institutions
- 2025Elaborate on the meaning of Inclusive Growth in the context of the Indian economy. Discuss the key strategies and instruments that can be employed to foster greater inclusion and ensure that the benefits of economic growth reach all sections of society.
- 2025Critically Examine the major poverty alleviation and employment generation programmes in India. How effective have they been in addressing rural and urban poverty?
All 49 questions, sorted by sub-topic, with model answers and practice.
Question from the official APPSC Group-I Mains 2017 paper. Answer written by Ghissu's engine and checked against our editorial standards. Found an error? Tell us and we correct it within 48 hours.