"The demographic structure and transition of Telangana deviated from the demographic structure and transition of India during 1961-2011" (as per census data). Examine with reference to sex ratio, rural-urban population, literacy and decadal growth rate of population.
In short
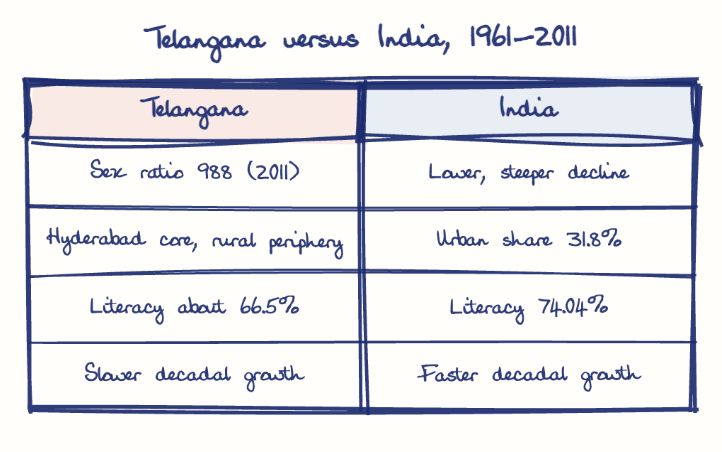
Between 1961 and 2011 Telangana deviated from India with a better sex ratio, slower decadal growth and faster but Hyderabad-centred urbanisation, alongside weaker literacy. In 2011 its sex ratio was 988 against India's 940, urban share about 38.9% against 31.2%, and literacy 66.5% against 74.04%.
Model answer
Ghissu Editorial · Verified 4 Oct 2026 · 287 words
Higher Sex Ratio
Telangana’s sex ratio was 988 females per 1000 males in 2011, surpassing India’s 940, reflecting better gender balance due to socio-cultural factors; later schemes like Kalyana Lakshmi1 and Shadi Mubarak (after 2014) seek to sustain it.
Faster Urbanization
By 2011, about 38.9% of Telangana’s population was urban against India’s 31.2%, so the state was more urbanised than the country.
Concentrated Growth
Hyderabad’s growth as an IT and pharma hub drove most of this urbanisation, while the agrarian interior stayed largely rural, creating a dual demographic character.
Lower Literacy Rates
Telangana’s literacy rate was 66.5% in 2011, below India’s 74.04%, with rural districts like Narayanpet and Jogulamba-Gadwal showing acute deficits and wider gender gaps.
Higher Education Growth
Post-2014, Telangana improved higher education enrolment, especially among Scheduled Castes and Tribes.
Slower Decadal Growth
Telangana’s population growth rate was lower than India’s, influenced by rural out-migration and Hyderabad’s in-migration, signaling an earlier demographic transition.
Demographic Dividend
The moderated growth and young population position Telangana to leverage its demographic dividend, supported by health schemes like Rajiv Aarogyasri and Anaemia Mukt Bharat.
This model answer is indicative and the model can make mistakes; please verify key facts independently.
Practise this question
1Get the answer sheet
Sized for this question.
2Write your answer
Timed, by hand.
3Get it marked
Your score and what to fix.
This chapter in the exam
Human resources, demography, education and health3 questions
Asked in 2 of 2 sittings since 2016
Most tested: Demographic structure and transition of Telangana using census indicators.
Question from the official TGPSC Group-I Mains 2024 paper. Answer written by Ghissu's engine and checked against our editorial standards. Found an error? Tell us and we correct it within 48 hours.